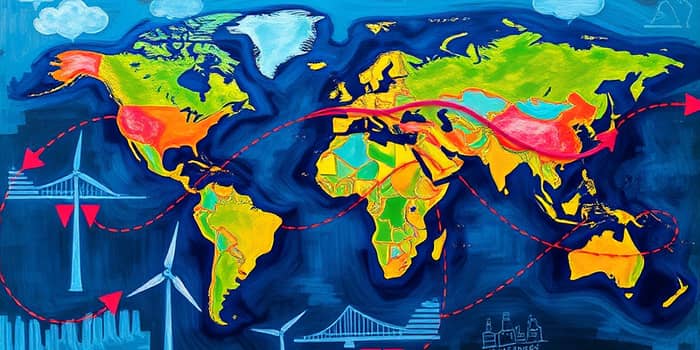
In early 2025, investors stand at a pivotal crossroads. After years of rapid expansion and the era of ultra-low interest rates, the global investment environment has shifted toward a landscape defined by heightened uncertainty and shifting paradigms. As capital flows ebb and surge, understanding regional trends, sectoral hotspots, and the risks that threaten to upend markets is more critical than ever. This article maps out the contours of opportunity and danger across the world’s most important investment arenas, offering both inspiration and practical guidance for navigating 2025’s economic frontier.
Headline Numbers: FDI, Trade, and Infrastructure Demands
Foreign direct investment fell by 11 percent in 2024, plunging to $1.5 trillion and marking the fourth consecutive year of decline. That contraction reflects a cautious global mood, spurred by geopolitical tensions and a recalibration of post-pandemic economic priorities. Meanwhile, global trade rose to nearly $33 trillion, underpinning sustained demand for logistics, ports, and digital infrastructure.
- FDI down 11% in 2024, to $1.5 trillion
- Global trade expanded to nearly $33 trillion
- Projected clean energy investments of $6.5 trillion per year by 2050
Against this backdrop, infrastructure and energy transition projects have moved to the forefront of asset allocation decisions. The World Investment Report 2025 highlights that developed and emerging markets alike must mobilize capital at unprecedented scale to meet decarbonization goals—creating both long-term tailwinds and complex financing challenges.
Regional Dynamics: Winners, Losers, and Shifting Flows
While headline FDI figures have dimmed, the distribution of capital continues to vary sharply by region. The United States, European Union, China, and emerging markets each tell different stories about investor confidence, regulatory environments, and strategic priorities.
- United States
- European Union (OECD)
- China & Asia-Pacific
- Emerging Markets
The U.S. net international investment position stood at –$24.61 trillion in Q1 2025, reflecting $36.85 trillion in foreign assets against $61.47 trillion in liabilities. That gap narrowed modestly as foreign currencies strengthened and global asset prices climbed. In Europe, FDI fell by 9 percent, but heavy commitments to renewable energy projects have helped anchor capital inflows. Meanwhile, Asia-Pacific markets navigate regulatory headwinds and supply chain reconfigurations, and emerging economies absorb volatile capital shifts with a relentless focus on infrastructure and digitalization.
Sectoral and Thematic Hotspots
Investors increasingly target themes that straddle traditional industry boundaries. Infrastructure remains foundational, but data centers, clean energy, and private capital are capturing disproportionate attention.
- Renewable energy and logistics corridors
- Data centers and cloud computing hubs
- Private equity and alternative assets
- Intersectional strategies (energy + digital)
Clean energy projects now demand as much as $6.5 trillion annually by midcentury, driving investment into solar, wind, grid modernization, and storage. At the same time, hyperscale data centers and cloud infrastructure are booming—particularly in North America and Asia—where digital transformation fuels electricity demand growth of over 2 percent per annum. In private markets, as globalization recalibrates deal flow, active managers chase value creation opportunities, mindful that the end of the era of cheap money has elevated due diligence to an art form.
Navigating Risk: Geopolitical, Macro, and Systemic Challenges
Global investors must continually assess an array of interconnected risks. U.S.-China strategic rivalry, regional security flashpoints, and supply chain realignment are elevating risk premiums across commodities, technology, and manufacturing sectors. Inflation and monetary policy normalizations have established a new, higher plateau for interest rates, while currency volatility—such as the $472.5 billion U.S. asset value uplift from forex gains in Q1 2025—adds another layer of complexity.
Climate change, pandemic aftereffects, and regulatory overhauls further complicate forecasts. In response, many institutions are building scenario-based frameworks, stress-testing portfolios against complex geopolitical risk premium adjustments and environmental shocks to safeguard returns and ensure liquidity in turbulent markets.
Strategic Outlook: Heat Maps, Mega Forces, and Active Value Creation
To chart a prudent path forward, leading asset managers deploy heat maps that rank regions and sectors by risk-reward profiles. These visual tools spotlight resilient areas—such as infrastructure, sustainability, and select technology niches—while flagging overly congested or highly volatile pockets.
Trendsetters emphasize investing in “mega forces”—structural shifts like AI, decarbonization, and demographic transitions—as both return drivers and risk mitigators. In practice, that means crafting portfolios that blend public and private assets, embrace active management and deep research, and focus on themes where unprecedented demand for clean energy infrastructure intersects with blending sustainability with technological innovation.
As we move deeper into 2025, the global investment map is being redrawn day by day. Success will favor those who combine a clear-eyed view of risk with a willingness to seize emerging opportunities—an approach that marries diligence with inspiration, data with vision, and caution with courage.
References
- https://www.bea.gov/news/2025/us-international-investment-position-1st-quarter-2025-and-annual-update
- https://www.mckinsey.com/industries/private-capital/our-insights/global-private-markets-report
- https://www.nuveen.com/global/insights/investment-outlook/annual-2025-outlook-asset-class-heat-map?type=us
- https://unctad.org/publication/world-investment-report-2025
- https://www.alliancebernstein.com/es/en-gb/institutions/insights/investment-insights/mapping-out-the-2025-investment-landscape-across-asset-classes.html
- https://www.blackrock.com/corporate/insights/blackrock-investment-institute/publications/outlook


